Sigma 룰은 로그 제품과 상관없이 쓰는 탐지 규칙 형식입니다. 이 글에서는 웹 서버 접근 로그를 대상으로 한 룰 3개를 작성하고, sigma-cli로 Elasticsearch 쿼리로 바꾼 뒤 Kibana Discover에서 실제로 탐지되는지 확인합니다. 다루는 것은 방어하는 쪽의 탐지 조건이며, 샘플 로그는 비공개 IP와 가짜 경로만으로 직접 만든 것입니다.
보안 기능을 끈 Elasticsearch와 Kibana를 사용합니다. 이 구성은 내 PC에서만 쓰는 실습용이며, 포트를 127.0.0.1에만 열어 둡니다. 공용 네트워크나 서버에 같은 설정으로 띄우지 않습니다. Kibana 설치 자체는 Kibana 설치하고 Elasticsearch에 연결하기에서 다룹니다. 이 글은 Docker로 한 번에 띄웁니다.
준비물
| 항목 | 내용 |
|---|---|
| Python | 3.12 |
| sigma-cli | 3.1.0 |
| pySigma | 1.5.1 |
| pysigma-backend-elasticsearch | 2.1.1 |
| Docker | Docker Desktop (Elasticsearch 와 Kibana 를 함께 띄우므로 총 메모리 4GB 이상 권장) |
| Elasticsearch, Kibana | 8.19.0 (보안 끔, 127.0.0.1 전용) |
| 예상 소요 시간 | 약 40분 (이미지 내려받는 시간 제외) |
작업 폴더와 가상환경을 만들고 도구를 설치합니다. 명령은 bash 기준이며 Windows에서는 Git Bash를 쓰고, 가상환경 활성화는 source .venv/bin/activate 대신 source .venv/Scripts/activate를 씁니다.
mkdir -p ~/sigma-demo/rules ~/sigma-demo/pipelines ~/sigma-demo/data && cd ~/sigma-demo
python -m venv .venv
source .venv/bin/activate
pip install sigma-cli pysigma-backend-elasticsearch
# 이 글과 같은 버전으로 맞추려면 위 줄 대신 다음처럼 버전을 고정합니다.
# pip install "sigma-cli==3.1.0" "pysigma-backend-elasticsearch==2.1.1"
sigma version
pip list | grep -i -E 'sigma|elasticsearch'
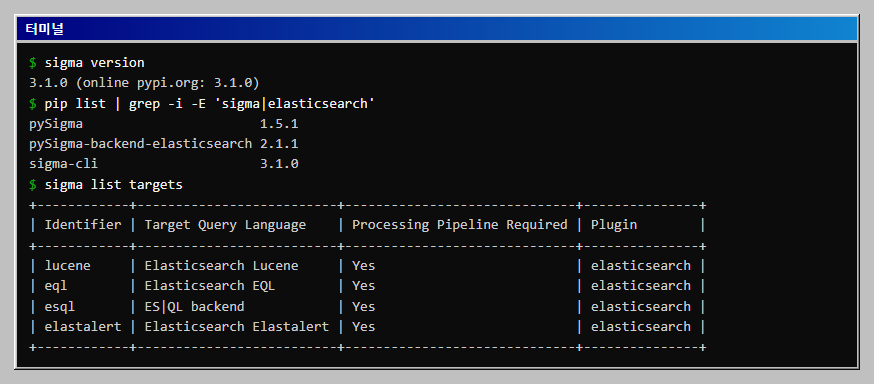
sigma list targets
기대 출력입니다. 버전이 다르면 변환 결과의 일부가 달라질 수 있습니다.
3.1.0 (online pypi.org: 3.1.0)
pySigma                       1.5.1
pySigma-backend-elasticsearch 2.1.1
sigma-cli                     3.1.0
| lucene     | Elasticsearch Lucene     | Yes                          | elasticsearch |
| eql        | Elasticsearch EQL        | Yes                          | elasticsearch |
| esql       | ES|QL backend            | Yes                          | elasticsearch |
| elastalert | Elasticsearch Elastalert | Yes                          | elasticsearch |
대상 이름은 lucene, eql, esql, elastalert 네 가지입니다. 이 글에서는 lucene을 씁니다. 네 대상 모두 "Processing Pipeline Required"가 Yes이므로, 기본적으로 pipeline이 필요합니다. 필드 이름을 어떻게 바꿀지 pipeline으로 알려 주지 않으면 변환이 거부됩니다. 4번 단계에서 직접 만듭니다.
1. Sigma 룰의 구조
룰은 YAML 파일 하나입니다. 이 글의 룰에서 쓰는 항목은 다음과 같습니다.
| 항목 | 역할 |
|---|---|
title, logsource, detection |
필수 항목. 룰 이름, 어떤 로그를 대상으로 하는지(이 글은 category: webserver), 조건 묶음(selection, filter)과 이를 조합하는 condition |
id |
권장 항목. 룰마다 고유한 UUID(v4) |
status |
성숙도(stable, test, experimental, deprecated, unsupported) |
falsepositives |
오탐이 날 수 있는 상황을 기록하는 목록 |
level |
심각도(critical, high, medium, low, informational) |
필수와 권장 구분은 Sigma 문서의 룰 작성 안내를 따랐습니다. 이 문서는 status, description, falsepositives, level을 필수나 선택으로 따로 표시하지 않으므로, 이 글에서는 룰을 읽는 사람에게 필요한 항목으로 모두 적습니다.
detection 안의 필드 이름은 Sigma 분류(taxonomy) 문서의 webserver 범주 필드를 씁니다. 이 범주에는 c-ip, cs-method, sc-status, cs-uri-stem, cs-uri-query, cs-user-agent 등이 있습니다. c-uri와 c-useragent는 proxy 범주의 필드이므로 웹 서버 룰에는 쓰지 않았습니다. 확인한 곳은 Sigma 분류 부록입니다. 이 분류는 경로(cs-uri-stem)와 쿼리 문자열(cs-uri-query)을 나눠 두었으므로 룰도 둘을 따로 다룹니다. 실제 인덱스의 필드 이름(ECS의 url.path 등)과는 변환할 때 pipeline으로 이어 줍니다. 룰은 로그 형식과 분리해 두고, 환경마다 달라지는 부분은 pipeline에 모으는 구조입니다.
2. 룰 3개 작성하기
첫 번째는 관리자 경로에 실패한 요청이 들어오는 경우입니다. 관리자 네트워크(10.0.0.0/24)에서 온 요청은 filter로 제외합니다.
cat > rules/web_admin_path_probe.yml <<'YML'
title: Admin Path Access Failed From Non Admin Network
id: 5f0c2f7a-8a3e-4c1e-9d3b-0a1b2c3d4e01
status: experimental
description: Detects requests to common admin paths that the web server rejected or did not find, coming from outside the admin network.
author: Copy and Run
date: 2026-10-16
logsource:
  category: webserver
detection:
  selection_path:
    cs-uri-stem|startswith:
      - '/admin'
      - '/wp-admin'
      - '/phpmyadmin'
  selection_status:
    sc-status:
      - 401
      - 403
      - 404
  filter_admin_network:
    c-ip|cidr: '10.0.0.0/24'
  condition: selection_path and selection_status and not filter_admin_network
falsepositives:
  - Administrators connecting from a new network or VPN range
  - Uptime monitors that request /admin on a schedule
  - Behind a proxy or load balancer the client address may be the proxy address, so the admin network filter can exclude too much or too little
level: medium
YML
두 번째는 User-Agent에 잘 알려진 스캐너 이름이 들어 있는 경우입니다. 보안팀이 정해진 장비(10.0.0.50)에서 돌리는 점검은 filter로 제외합니다. User-Agent는 공격자가 마음대로 바꿀 수 있어서 이름만 바꾸면 이 룰을 피할 수 있으므로, 이 룰은 보조 신호로 씁니다.
cat > rules/web_scanner_user_agent.yml <<'YML'
title: Known Scanner Name In User Agent
id: 5f0c2f7a-8a3e-4c1e-9d3b-0a1b2c3d4e02
status: experimental
description: Detects User-Agent strings that contain the name of a well known web vulnerability scanner. The User-Agent is easy to forge, so treat this as a supporting signal and not as proof.
author: Copy and Run
date: 2026-10-16
logsource:
  category: webserver
detection:
  selection:
    cs-user-agent|contains:
      - 'sqlmap'
      - 'nikto'
      - 'masscan'
      - 'dirbuster'
      - 'Nmap Scripting Engine'
  filter_scheduled_scan:
    c-ip: '10.0.0.50'
  condition: selection and not filter_scheduled_scan
falsepositives:
  - Authorized vulnerability scans from the security team (host 10.0.0.50 is excluded)
  - Behind a proxy or load balancer the client address may be the proxy address, so the host exclusion can hide real scanners
level: high
YML
세 번째는 URL의 경로나 쿼리 문자열에 상위 디렉터리 이동 문자열(../와 그 인코딩)이 들어 있는데 응답이 200인 경우입니다. 요청만 있는 것과 응답이 나간 것은 대응 우선순위가 다르므로 상태 코드를 함께 봅니다. 다만 200은 응답이 나갔다는 뜻이며 공격이 성공했다는 뜻은 아닙니다. 파일 내용이 실제로 나갔는지는 응답 본문 크기 등으로 따로 확인합니다. 이 룰의 패턴은 ../, ..%2f, %2e%2e%2f만 찾으므로 ..\, 이중 인코딩(%252e), %5c 같은 변형은 놓칩니다. 그래서 level을 medium으로 두었고, 놓치는 변형은 패턴을 늘려 보완합니다. cs-uri-stem과 cs-uri-query 두 묶음은 하나라도 맞으면 일치하는 OR 관계입니다.
cat > rules/web_path_traversal_success.yml <<'YML'
title: Path Traversal Sequence With Response 200
id: 5f0c2f7a-8a3e-4c1e-9d3b-0a1b2c3d4e03
status: experimental
description: Detects URLs that contain a parent directory sequence and received an HTTP 200 response. A 200 only means the server sent a response; whether the file content was actually returned must be checked separately, for example by the response size. Variants such as backslash sequences and double encoding are not covered.
author: Copy and Run
date: 2026-10-16
logsource:
  category: webserver
detection:
  selection_uri:
    - cs-uri-stem|contains:
        - '../'
        - '..%2f'
        - '%2e%2e%2f'
    - cs-uri-query|contains:
        - '../'
        - '..%2f'
        - '%2e%2e%2f'
  selection_status:
    sc-status: 200
  condition: selection_uri and selection_status
falsepositives:
  - Applications that put relative paths in URLs on purpose
  - Requests whose response is a normal page or an error page returned with status 200
level: medium
YML
id는 룰마다 고유한 UUID여야 합니다. 직접 만들 때는 python -c "import uuid; print(uuid.uuid4())"로 새로 만듭니다.
3. sigma check로 문법 점검하기
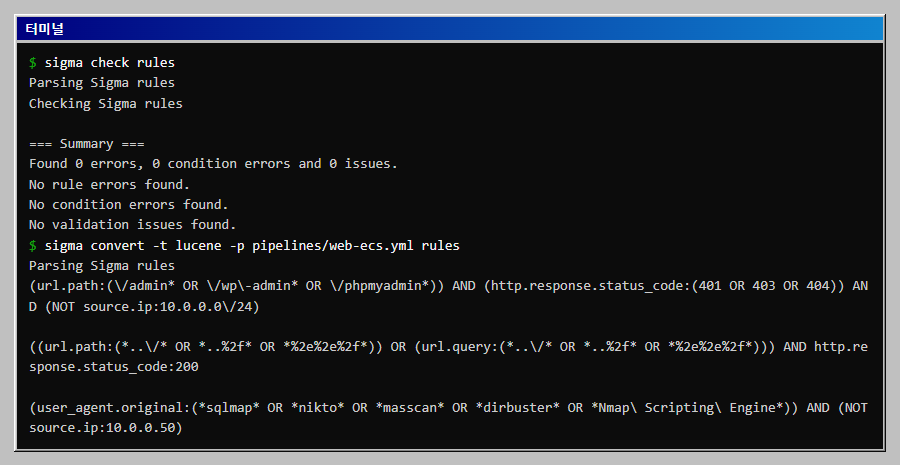
sigma check rules
기대 출력입니다.
Parsing Sigma rules
Checking Sigma rules

=== Summary ===
Found 0 errors, 0 condition errors and 0 issues.
No rule errors found.
No condition errors found.
No validation issues found.
오류가 있으면 종료 코드가 1로 나옵니다. 예를 들어 condition에 오타가 있어 filter_scheduled_scan을 filter_sheduled_scan으로 적으면 다음과 같이 나옵니다(파일 경로는 줄였습니다).
Condition error in ...web_scanner_typo.yml:Detection 'filter_sheduled_scan' not defined in detections in ...web_scanner_typo.yml
...
Found 0 errors, 1 condition errors and 0 issues.
Check failure
CI에서 룰 저장소를 관리한다면 이 명령의 종료 코드를 게이트로 쓸 수 있습니다.
4. 필드 이름을 ECS로 바꾸는 pipeline 만들기
pipeline 없이 변환하면 다음과 같이 거부됩니다.
sigma convert -t lucene rules/web_scanner_user_agent.yml
Error:
Processing pipeline required by backend! Define a custom pipeline or choose a predefined one.
...
If you know what you're doing add --without-pipeline to your command line to suppress this error.
sigma list pipelines에 있는 기본 제공 pipeline(ecs_windows, ecs_zeek_beats, ecs_kubernetes 등)에는 웹 서버 접근 로그용이 없습니다. 그래서 필드 이름 매핑을 직접 적습니다. logsource가 webserver인 룰에만 적용하도록 조건을 걸었습니다.
cat > pipelines/web-ecs.yml <<'YML'
name: Webserver access log to ECS
priority: 20
transformations:
  - id: web_field_mapping
    type: field_name_mapping
    mapping:
      c-ip: source.ip
      cs-method: http.request.method
      cs-uri-stem: url.path
      cs-uri-query: url.query
      cs-user-agent: user_agent.original
      sc-status: http.response.status_code
    rule_conditions:
      - type: logsource
        category: webserver
YML
이 pipeline의 매핑은 직접 정한 것입니다. 같은 블로그의 Logstash로 nginx 로그를 Grok으로 파싱하고 ECS로 정규화하기가 만드는 필드는 source.address와 url.original이라서, 이 글의 source.ip, url.path, url.query와는 이름이 다릅니다. 두 글을 이어서 쓸 때는 pipeline의 매핑을 c-ip: source.address로 바꿔야 합니다. 경로와 쿼리를 나누지 않고 url.original 하나에 담기므로, 룰의 cs-uri-stem과 cs-uri-query 조건도 url.original을 보도록 고쳐 써야 합니다.
5. Lucene 쿼리로 변환하기
sigma convert -t lucene -p pipelines/web-ecs.yml rules
기대 출력입니다. 첫 줄 Parsing Sigma rules는 진행 표시이고, 룰 파일 하나가 쿼리 한 줄이 됩니다.
Parsing Sigma rules
(url.path:(\/admin* OR \/wp\-admin* OR \/phpmyadmin*)) AND (http.response.status_code:(401 OR 403 OR 404)) AND (NOT source.ip:10.0.0.0\/24)

((url.path:(*..\/* OR *..%2f* OR *%2e%2e%2f*)) OR (url.query:(*..\/* OR *..%2f* OR *%2e%2e%2f*))) AND http.response.status_code:200

(user_agent.original:(*sqlmap* OR *nikto* OR *masscan* OR *dirbuster* OR *Nmap\ Scripting\ Engine*)) AND (NOT source.ip:10.0.0.50)
not filter_...는 NOT 절로, 목록은 OR로, contains는 양쪽 와일드카드(*값*)로 바뀐 것을 확인합니다. 필드 이름은 pipeline 덕분에 모두 ECS 이름이 됐습니다.
출력 형식은 -f 옵션으로 고릅니다. sigma list formats lucene으로 확인하면 default, kibana_ndjson, dsl_lucene, siem_rule, siem_rule_ndjson이 있습니다. API로 바로 보낼 수 있는 dsl_lucene은 다음과 같습니다.
sigma convert -t lucene -p pipelines/web-ecs.yml -f dsl_lucene -j 2 rules/web_scanner_user_agent.yml
{
  "query": {
    "bool": {
      "must": [
        {
          "query_string": {
            "query": "(user_agent.original:(*sqlmap* OR *nikto* OR *masscan* OR *dirbuster* OR *Nmap\\ Scripting\\ Engine*)) AND (NOT source.ip:10.0.0.50)",
            "analyze_wildcard": true
          }
        }
      ]
    }
  }
}
같은 룰을 다른 대상으로도 바꿀 수 있습니다. EQL은 다음처럼 나옵니다. 이 글에서는 EQL 쿼리를 Elasticsearch에 실행해 보지는 않았습니다.
sigma convert -t eql -p pipelines/web-ecs.yml rules/web_scanner_user_agent.yml
any where (user_agent.original like~ ("*sqlmap*", "*nikto*", "*masscan*", "*dirbuster*", "*Nmap Scripting Engine*")) and (not source.ip=="10.0.0.50")
6. Elasticsearch와 Kibana 띄우기
모든 리소스 이름에 cr-sigma- 접두어를 붙였고, 포트는 127.0.0.1에만 열었습니다. 이미지를 내려받는 데 몇 분 걸립니다.
docker network create cr-sigma-net
docker volume create cr-sigma-esdata

docker run -d --name cr-sigma-es --network cr-sigma-net \
  -p 127.0.0.1:19500:9200 \
  -e discovery.type=single-node \
  -e xpack.security.enabled=false \
  -e ES_JAVA_OPTS="-Xms512m -Xmx512m" \
  -v cr-sigma-esdata:/usr/share/elasticsearch/data \
  docker.elastic.co/elasticsearch/elasticsearch:8.19.0

docker run -d --name cr-sigma-kibana --network cr-sigma-net \
  -p 127.0.0.1:19501:5601 \
  -e ELASTICSEARCH_HOSTS=http://cr-sigma-es:9200 \
  docker.elastic.co/kibana/kibana:8.19.0

until curl -sf http://127.0.0.1:19500 >/dev/null; do sleep 5; done
curl -s http://127.0.0.1:19500 | grep number
until curl -sf http://127.0.0.1:19501/api/status >/dev/null; do sleep 5; done
echo "Kibana 기동 완료"
기대 출력입니다. Kibana는 기동에 1~3분 걸립니다.
    "number" : "8.19.0",
Kibana 기동 완료
7. 샘플 로그 색인하기
먼저 인덱스 매핑을 정합니다. url.path, url.query, user_agent.original에는 소문자 normalizer를 붙입니다. Sigma의 contains는 대소문자를 구분하지 않는데, Elasticsearch의 keyword 필드에 대한 와일드카드 검색은 구분하기 때문입니다. 이 설정이 없으면 Nikto처럼 대문자가 섞인 User-Agent를 놓칩니다("자주 막히는 곳" 참고).
cat > data/mapping.json <<'EOF'
{
  "settings": {
    "analysis": {
      "normalizer": {
        "lowercase_norm": { "type": "custom", "filter": ["lowercase"] }
      }
    }
  },
  "mappings": {
    "properties": {
      "@timestamp": { "type": "date" },
      "source": { "properties": { "ip": { "type": "ip" } } },
      "http": { "properties": {
        "request": { "properties": { "method": { "type": "keyword" } } },
        "response": { "properties": { "status_code": { "type": "long" } } } } },
      "url": { "properties": {
        "path": { "type": "keyword", "normalizer": "lowercase_norm" },
        "query": { "type": "keyword", "normalizer": "lowercase_norm" } } },
      "user_agent": { "properties": { "original": { "type": "keyword", "normalizer": "lowercase_norm" } } }
    }
  }
}
EOF

curl -s -X PUT 127.0.0.1:19500/web-access-sigma \
  -H 'Content-Type: application/json' --data-binary @data/mapping.json
샘플 로그 14건입니다. 정상 요청, 외부에서 온 관리자 경로 탐색, 관리자 네트워크에서 온 같은 경로 요청, 스캐너 User-Agent(허용된 점검 장비 포함), 경로 이동 문자열 두 건이 섞여 있습니다.
cat > data/access.ndjson <<'EOF'
{"index":{"_index":"web-access-sigma"}}
{"@timestamp":"2026-10-16T09:00:01Z","source":{"ip":"10.0.0.21"},"http":{"request":{"method":"GET"},"response":{"status_code":200}},"url":{"path":"/index.html"},"user_agent":{"original":"Mozilla/5.0 (Windows NT 10.0; Win64; x64)"}}
{"index":{"_index":"web-access-sigma"}}
{"@timestamp":"2026-10-16T09:00:05Z","source":{"ip":"10.0.0.22"},"http":{"request":{"method":"GET"},"response":{"status_code":200}},"url":{"path":"/products/list"},"user_agent":{"original":"Mozilla/5.0 (Macintosh; Intel Mac OS X 14_0)"}}
{"index":{"_index":"web-access-sigma"}}
{"@timestamp":"2026-10-16T09:01:10Z","source":{"ip":"192.168.5.77"},"http":{"request":{"method":"GET"},"response":{"status_code":404}},"url":{"path":"/wp-admin/login.php"},"user_agent":{"original":"Mozilla/5.0 (X11; Linux x86_64)"}}
{"index":{"_index":"web-access-sigma"}}
{"@timestamp":"2026-10-16T09:01:12Z","source":{"ip":"192.168.5.77"},"http":{"request":{"method":"GET"},"response":{"status_code":403}},"url":{"path":"/admin/config"},"user_agent":{"original":"Mozilla/5.0 (X11; Linux x86_64)"}}
{"index":{"_index":"web-access-sigma"}}
{"@timestamp":"2026-10-16T09:01:15Z","source":{"ip":"192.168.5.77"},"http":{"request":{"method":"GET"},"response":{"status_code":404}},"url":{"path":"/phpmyadmin/index.php"},"user_agent":{"original":"Mozilla/5.0 (X11; Linux x86_64)"}}
{"index":{"_index":"web-access-sigma"}}
{"@timestamp":"2026-10-16T09:02:00Z","source":{"ip":"10.0.0.15"},"http":{"request":{"method":"GET"},"response":{"status_code":200}},"url":{"path":"/admin/dashboard"},"user_agent":{"original":"Mozilla/5.0 (Windows NT 10.0; Win64; x64)"}}
{"index":{"_index":"web-access-sigma"}}
{"@timestamp":"2026-10-16T09:02:30Z","source":{"ip":"10.0.0.15"},"http":{"request":{"method":"GET"},"response":{"status_code":403}},"url":{"path":"/admin/audit-export"},"user_agent":{"original":"Mozilla/5.0 (Windows NT 10.0; Win64; x64)"}}
{"index":{"_index":"web-access-sigma"}}
{"@timestamp":"2026-10-16T09:03:00Z","source":{"ip":"172.16.8.9"},"http":{"request":{"method":"GET"},"response":{"status_code":200}},"url":{"path":"/login"},"user_agent":{"original":"sqlmap/1.8.4#stable (https://sqlmap.org)"}}
{"index":{"_index":"web-access-sigma"}}
{"@timestamp":"2026-10-16T09:03:04Z","source":{"ip":"172.16.8.9"},"http":{"request":{"method":"POST"},"response":{"status_code":500}},"url":{"path":"/login"},"user_agent":{"original":"sqlmap/1.8.4#stable (https://sqlmap.org)"}}
{"index":{"_index":"web-access-sigma"}}
{"@timestamp":"2026-10-16T09:04:00Z","source":{"ip":"172.16.8.30"},"http":{"request":{"method":"GET"},"response":{"status_code":200}},"url":{"path":"/"},"user_agent":{"original":"Mozilla/5.00 (Nikto/2.5.0) (Evasions:None) (Test:Port Check)"}}
{"index":{"_index":"web-access-sigma"}}
{"@timestamp":"2026-10-16T09:05:00Z","source":{"ip":"10.0.0.50"},"http":{"request":{"method":"GET"},"response":{"status_code":200}},"url":{"path":"/"},"user_agent":{"original":"Mozilla/5.00 (Nikto/2.5.0) (Evasions:None) (Test:Port Check)"}}
{"index":{"_index":"web-access-sigma"}}
{"@timestamp":"2026-10-16T09:06:00Z","source":{"ip":"192.168.5.80"},"http":{"request":{"method":"GET"},"response":{"status_code":200}},"url":{"path":"/download","query":"file=../../etc/passwd"},"user_agent":{"original":"curl/8.5.0"}}
{"index":{"_index":"web-access-sigma"}}
{"@timestamp":"2026-10-16T09:06:20Z","source":{"ip":"192.168.5.80"},"http":{"request":{"method":"GET"},"response":{"status_code":404}},"url":{"path":"/download","query":"file=..%2f..%2fsecret.txt"},"user_agent":{"original":"curl/8.5.0"}}
{"index":{"_index":"web-access-sigma"}}
{"@timestamp":"2026-10-16T09:07:00Z","source":{"ip":"10.0.0.23"},"http":{"request":{"method":"GET"},"response":{"status_code":200}},"url":{"path":"/docs/guide.html"},"user_agent":{"original":"Mozilla/5.0 (Windows NT 10.0; Win64; x64)"}}
EOF

curl -s -X POST '127.0.0.1:19500/_bulk?refresh=true' \
  -H 'Content-Type: application/x-ndjson' --data-binary @data/access.ndjson | grep -o '"errors":[a-z]*'
curl -s 127.0.0.1:19500/web-access-sigma/_count
기대 출력입니다.
"errors":false
{"count":14,"_shards":{"total":1,"successful":1,"skipped":0,"failed":0}}
8. 변환한 쿼리로 탐지 확인하기
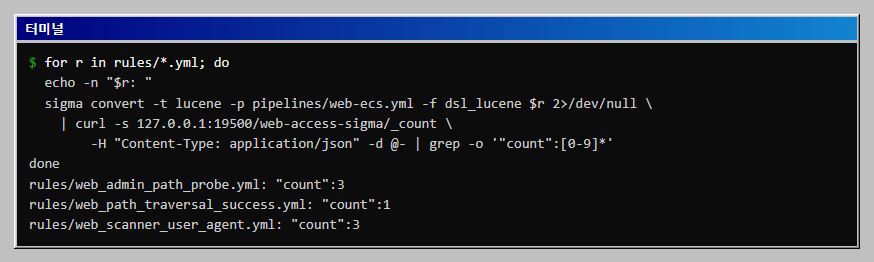
먼저 터미널에서 룰마다 몇 건이 걸리는지 봅니다. dsl_lucene 출력은 검색 API 본문 그대로라서 curl로 바로 보낼 수 있습니다.
for r in rules/*.yml; do
  echo -n "$r: "
  sigma convert -t lucene -p pipelines/web-ecs.yml -f dsl_lucene $r 2>/dev/null \
    | curl -s 127.0.0.1:19500/web-access-sigma/_count \
        -H "Content-Type: application/json" -d @- | grep -o '"count":[0-9]*'
done
기대 출력입니다.
rules/web_admin_path_probe.yml: "count":3
rules/web_path_traversal_success.yml: "count":1
rules/web_scanner_user_agent.yml: "count":3
로그를 의도한 대로 해석한 결과입니다. 관리자 경로 룰은 192.168.5.77의 3건만 잡고, 관리자 네트워크의 10.0.0.15가 받은 403은 제외합니다. 스캐너 룰은 sqlmap 2건과 Nikto 1건을 잡고, 허용된 점검 장비 10.0.0.50의 Nikto는 제외합니다. 경로 이동 룰은 쿼리 문자열에 ../가 있고 응답이 200인 1건만 잡고 404였던 요청은 제외합니다. 이 1건도 응답 본문 크기를 보기 전에는 파일이 나갔는지 알 수 없습니다.
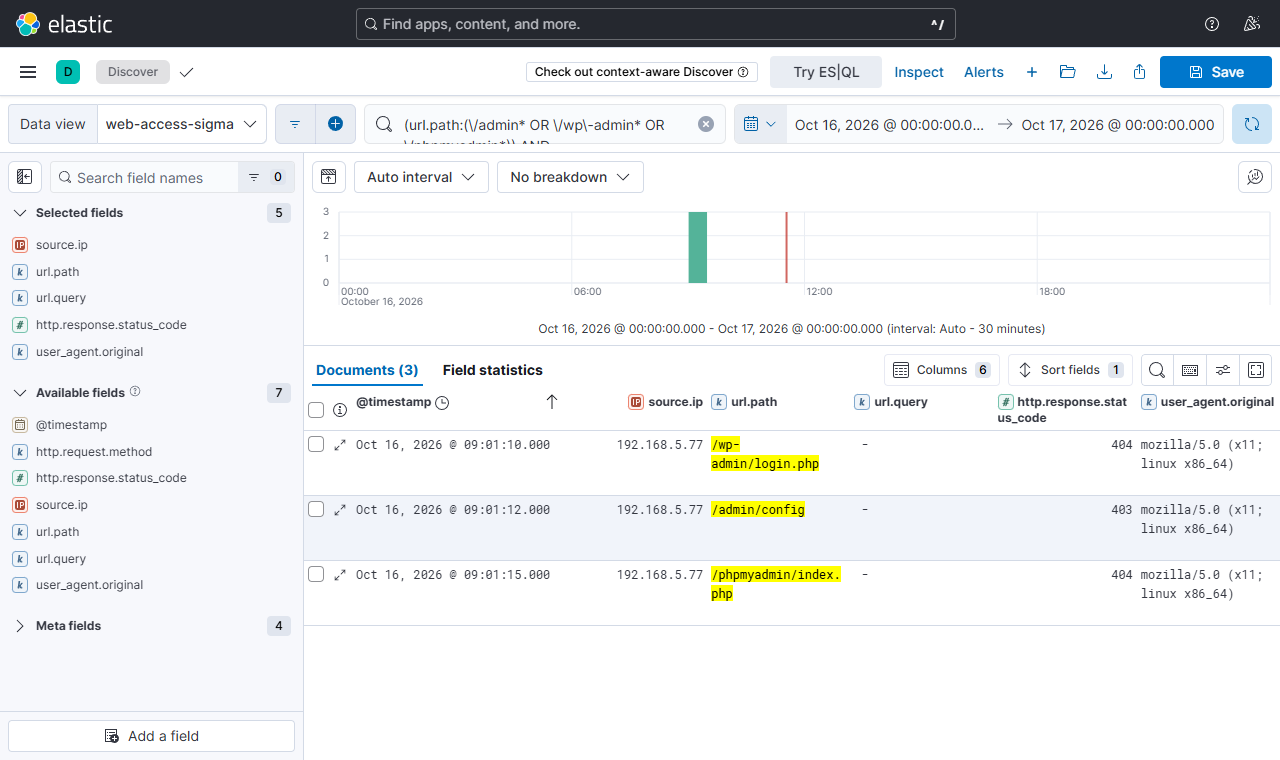
이제 Kibana에서 같은 쿼리를 확인합니다. 브라우저에서 http://127.0.0.1:19501을 열고 다음 순서로 진행합니다.
- 왼쪽 메뉴에서 Stack Management, Data Views로 가서
Create data view를 누릅니다. - Name과 Index pattern에
web-access-sigma, Timestamp field에@timestamp를 지정하고 저장합니다. - Discover를 열고 데이터 뷰를
web-access-sigma로 고릅니다. 시간 범위는Oct 16, 2026 @ 00:00:00.000부터Oct 17, 2026 @ 00:00:00.000까지 절대 시간으로 지정합니다. 샘플 로그의 시각은 UTC이고 Discover는 브라우저 시간대로 보여 주므로, 시간대가 다르면 표시되는 시각과 범위를 그만큼 옮겨야 합니다. 이 글의 화면은 Kibana의 시간대 설정을 UTC로 맞춘 상태입니다. - 검색창 오른쪽의 언어 선택(KQL)을 눌러
Lucene으로 바꿉니다. 이 단계가 빠지면 변환한 쿼리가 KQL로 해석되어 오류가 납니다. - 5번 단계에서 얻은 쿼리 한 줄을 검색창에 붙여 넣고 Enter를 누릅니다.
먼저 관리자 경로 룰의 쿼리입니다.
(url.path:(\/admin* OR \/wp\-admin* OR \/phpmyadmin*)) AND (http.response.status_code:(401 OR 403 OR 404)) AND (NOT source.ip:10.0.0.0\/24)
다음은 스캐너 룰의 쿼리입니다.
(user_agent.original:(*sqlmap* OR *nikto* OR *masscan* OR *dirbuster* OR *Nmap\ Scripting\ Engine*)) AND (NOT source.ip:10.0.0.50)
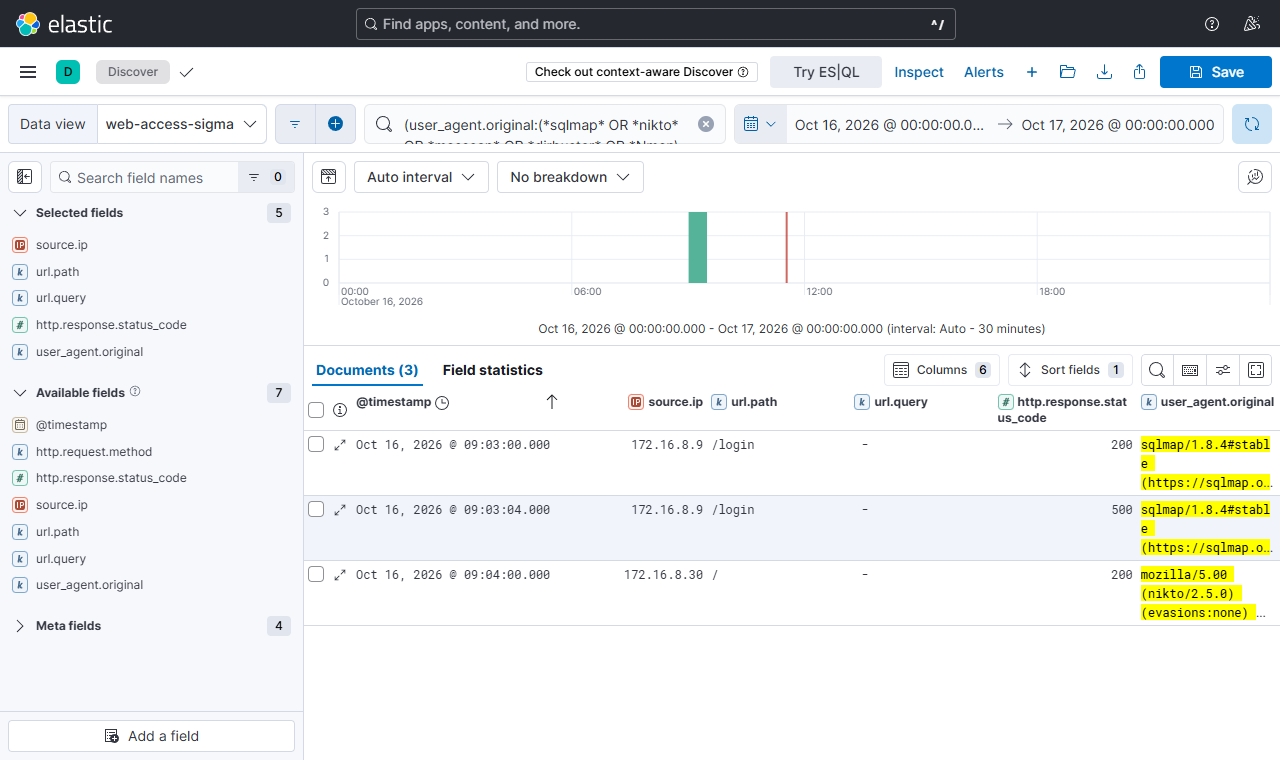
Discover에서 User-Agent가 소문자로 보이는 것은 normalizer가 값을 소문자로 저장해 필드에 보여 주기 때문입니다. 원본 문서(_source)는 그대로입니다.
9. 오탐을 줄이는 조건과 기록
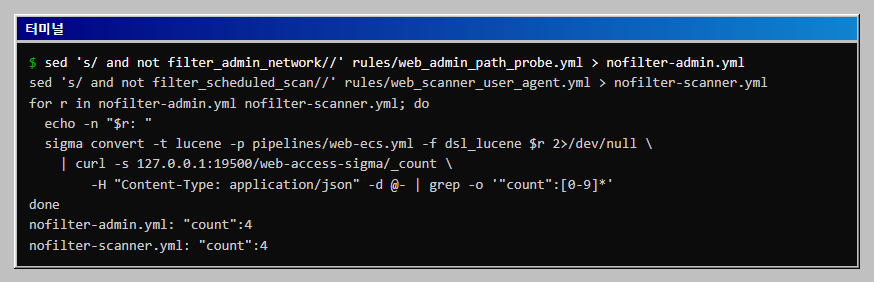
두 룰의 filter_로 시작하는 조건이 오탐을 줄이는 부분입니다. filter를 빼고 같은 로그에 돌리면 어떻게 달라지는지 봅니다.
sed 's/ and not filter_admin_network//' rules/web_admin_path_probe.yml > nofilter-admin.yml
sed 's/ and not filter_scheduled_scan//' rules/web_scanner_user_agent.yml > nofilter-scanner.yml

for r in nofilter-admin.yml nofilter-scanner.yml; do
  echo -n "$r: "
  sigma convert -t lucene -p pipelines/web-ecs.yml -f dsl_lucene $r 2>/dev/null \
    | curl -s 127.0.0.1:19500/web-access-sigma/_count \
        -H "Content-Type: application/json" -d @- | grep -o '"count":[0-9]*'
done
nofilter-admin.yml: "count":4
nofilter-scanner.yml: "count":4
filter가 있을 때는 3건이었으므로 각각 한 건씩 줄어든 것입니다. 관리자 네트워크의 /admin/audit-export 403과 허용된 점검 장비의 Nikto 요청이 그 한 건입니다.
filter로 제외하는 조건에는 책임이 따릅니다. 먼저 이 글의 샘플은 클라이언트가 서버에 직접 접속한 로그입니다. 프록시나 로드밸런서 뒤에 있는 서버에서는 source.ip가 프록시 주소가 되어, 10.0.0.0/24와 10.0.0.50 제외 조건이 의도와 다르게 동작합니다. 그때는 X-Forwarded-For 같은 헤더에서 뽑은 실제 클라이언트 주소 필드를 쓰도록 pipeline을 바꿉니다. 또 제외한 10.0.0.0/24에서 실제 공격이 시작되면 이 룰로는 보이지 않습니다. 그래서 제외한 이유와 한계를 falsepositives에 적어 두고, 룰 파일을 바꾸는 사람이 근거를 알 수 있게 합니다. 처음에는 넓게 잡고 오탐이 확인된 것만 하나씩 제외하는 순서가 안전합니다.
자주 막히는 곳
Processing pipeline required by backend!가 나오며 변환되지 않습니다. 네 대상(lucene, eql, esql, elastalert) 모두 기본적으로 pipeline을 요구합니다. -p pipelines/web-ecs.yml을 붙입니다. 필드 이름을 바꾸지 않고 cs-user-agent 같은 원래 이름으로 변환하려면 --without-pipeline을 쓰지만, 인덱스에 그 필드가 있어야 의미가 있습니다.
대문자가 섞인 User-Agent가 탐지되지 않습니다. normalizer 없이 keyword 필드를 쓰면 *nikto*가 Nikto/2.5.0과 맞지 않습니다. 이 글의 샘플 로그를 normalizer 없는 매핑에 색인하면 스캐너 룰이 3건 대신 sqlmap 2건만 잡았고, 172.16.8.30의 Nikto 요청이 빠졌습니다. 7번의 매핑처럼 소문자 normalizer를 붙이고 인덱스를 다시 만들어 색인합니다.
Kibana에서 쿼리를 붙여 넣으면 구문 오류가 납니다. 검색창 언어가 KQL이어서 그렇습니다. 변환 결과는 Lucene 쿼리이므로 언어를 Lucene으로 바꿉니다.
Discover에 문서가 한 건도 나오지 않습니다. 시간 범위를 확인합니다. 샘플 로그는 2026-10-16 날짜이므로 기본값인 최근 15분으로는 보이지 않습니다. 7번에서 절대 시간으로 지정한 범위를 그대로 씁니다.
sigma check가 파일 이름 길이 문제를 알려 줍니다. 룰 파일 이름이 너무 짧거나 길 때 나오는 경고(FilenameLengthIssue)입니다. 이 글처럼 web_admin_path_probe.yml 정도의 설명적인 이름을 쓰면 나오지 않습니다.
이어서 해 볼 것
- 횟수 조건(correlation) 룰: "같은 IP에서 1분에 404가 10번 이상"처럼 횟수와 시간 창을 쓰는 룰은 Sigma의 correlation 룰로 적습니다. 이 환경에서
-t lucene으로 변환하면Backend does not support correlation rules.오류가 나고,-t esql로는stats ... by쿼리로 변환됩니다. ES|QL 변환 결과는 실행해 확인하지 않았으므로, 쓰려면 직접 돌려 봅니다. - 룰 모음 가져오기: SigmaHQ의 공개 룰 저장소에서
category: webserver룰을 받아 변환해 봅니다. 이 글의 pipeline은c-ip,cs-method,cs-uri-stem,cs-uri-query,cs-user-agent,sc-status여섯 필드만 매핑합니다. 이 글에서는 공개 룰을 변환해 보지 않았고, 공개 룰이 쓰는 필드가 이 pipeline에 없으면 매핑을 보강해야 합니다. - Kibana 탐지 룰로 올리기:
-f siem_rule또는-f siem_rule_ndjson형식으로 변환하면 Elastic Security의 탐지 룰 가져오기 형식이 됩니다. 이 글에서는 변환 형식이 있는 것만 확인했고, Kibana에 가져오는 과정은 해 보지 않았습니다.
정리
실습이 끝나면 만든 컨테이너, 네트워크, 볼륨, 작업 폴더를 지웁니다.
cd ~
docker rm -f cr-sigma-kibana cr-sigma-es
docker network rm cr-sigma-net
docker volume rm cr-sigma-esdata
deactivate
rm -rf ~/sigma-demo
확인 범위
직접 실행한 부분은 설치, sigma check(정상과 condition 오타 두 경우), -t lucene의 default와 dsl_lucene 변환, -t eql 변환 출력, correlation 룰의 lucene과 esql 변환 시도, Elasticsearch 8.19.0과 Kibana 8.19.0 기동, 샘플 14건 색인, 룰별 일치 건수 확인, Kibana Discover에서 관리자 경로 룰과 스캐너 룰 쿼리 확인, filter 제거 비교입니다. 환경은 Windows의 Git Bash, Python 3.12, Docker Desktop, sigma-cli 3.1.0, pySigma 1.5.1, pysigma-backend-elasticsearch 2.1.1입니다.
본문의 명령과 출력은 필드 이름을 cs-uri-stem, cs-uri-query, cs-user-agent로 바꾼 룰로 모두 다시 실행해 확인했습니다. 룰의 필드 이름은 Sigma 분류 문서를 보고 정했습니다. 프록시 뒤 환경, Logstash 글의 필드(source.address, url.original)로 이어 쓰는 경우는 실행해 보지 않았습니다. 실행 중 docker stats로 본 메모리는 Elasticsearch 약 1.2GiB, Kibana 약 0.7GiB입니다. 경로 이동 룰의 Discover 화면은 캡처하지 않고 건수만 확인했습니다. EQL과 ES|QL 쿼리는 변환 출력만 확인했고 Elasticsearch에 실행하지 않았습니다. siem_rule 형식의 Kibana 가져오기와 Elastic Security 탐지 룰 실행도 해 보지 않았습니다. 샘플 로그는 필드 구조를 ECS에 맞춰 직접 만든 것이며, 실제 웹 서버 로그를 수집기로 적재하는 과정은 다루지 않았습니다.
이 글의 다음 단계
- Kibana 대시보드와 GeoIP 지도로 접속 현황 보기Docker로 Elasticsearch 8.19와 Kibana 8.19를 띄우고, ingest pipeline의 geoip 프로세서로 접근 로그의 IP에 위치 정보를 붙입니다. 상위 IP, 상태 코드, 시간대별 요청 수, 지도 패널을 대시보드로 저장하고 저장 객체를 내보내 다시 가져옵니다.
- Logstash로 nginx 로그를 Grok으로 파싱하고 ECS로 정규화하기nginx 접근 로그를 Logstash grok으로 파싱해 ECS 필드 이름으로 정리하고, 파싱에 실패한 로그를 Elasticsearch 쿼리로 세어 별도 인덱스로 보냅니다. Docker로 Elasticsearch 8.19와 Logstash 8.19를 띄워 로컬에서 끝까지 돌립니다.